
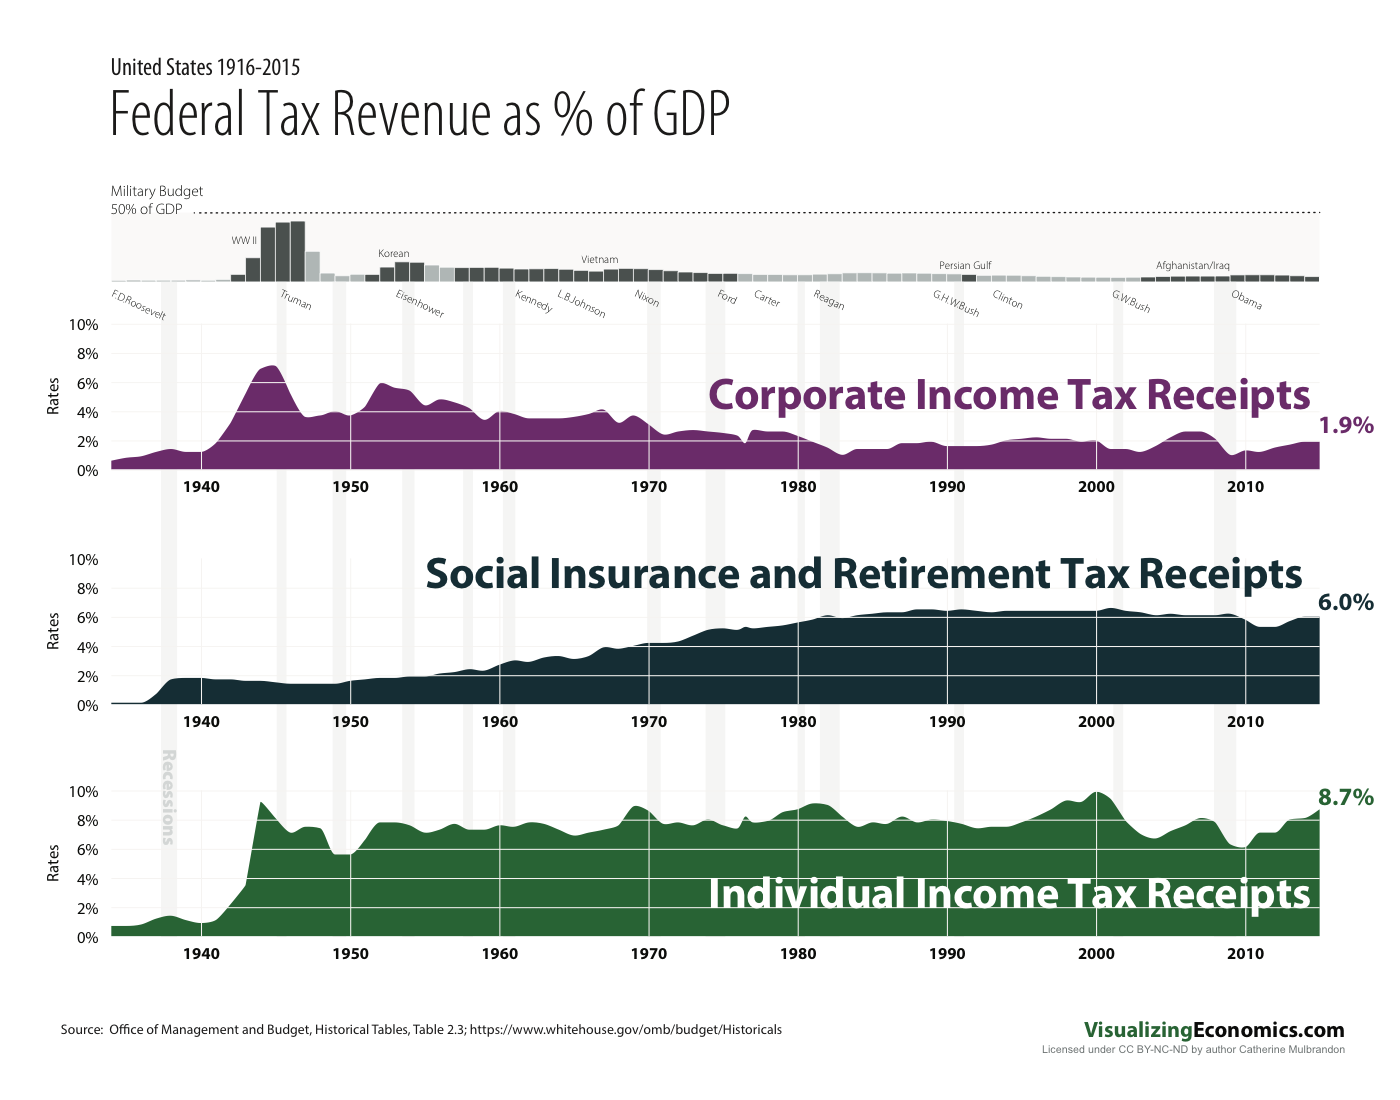
My last set of graphs shows the decline of C corporations since the 1980s while the share of pass-through businesses increased. Pass-through businesses do not pay taxes through the corporate tax code but through individual tax code. Here are the three main sources of federal revenue (% of GDP) and you can see how corporate income tax receipts were greater in the decades between 1940-1980 but with very little change in the individual income tax receipts.
Data is from the Office of Management and Budget, Historical Tables, Table 2.3
10/3/2017 Fixed y-axis label to read % of GDP