Mastodon

Area Graph

Taxing Businesses: Personal Consumption

Part 7 of a series about Taxing Businesses


As corporate savings decreased (as a consequence of increasing the number of pass-through businesses), it was not replaced by personal savings but by personal consumption. Since the 1980s, consumption as a percent of GDP, went from around 60% to 68% mostly due to more money spent on services.

Data source: Federal Reserve Economic Data

The codes used to download data: 

  • DDURRE1A156NBEA Durable goods

  • DSERRE1A156NBEA Services

  • DNDGRE1A156NBEA Nondurable goods,

Related Posts Plugin for WordPress, Blogger...

Taxing Businesses: Net Savings

Part 6 of a series about Taxing Businesses

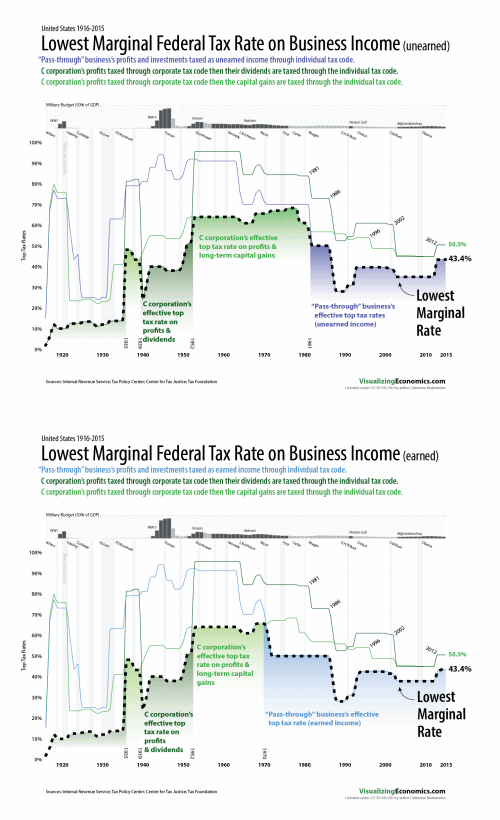
In the 1980s the effective top rate on pass-throughs (unearned) was dropped to match the corporate rate on profits, making pass-through businesses more desirable than in the past since with pass-throughs owners were not double taxed. As a consequence, these tax changes created an incentive to change the business structure from C corporation to pass-throughs. The double taxation of corporate profits had provided an incentive for corporations to retain earrings (to save) but a pass-through's profit is tax indifferent between saving and consumption (there is no incentive to either save it or spend it).

C corporation's share of net business income dropped from 1980 to 2012, 68% to 37%. The effect of fewer C corporations and more pass-through businesses was less savings since retained earnings by corporations was half of private savings (pdf). So, tax-induced decrease in number of corporations had a substantial effect on the level of private savings in the US.

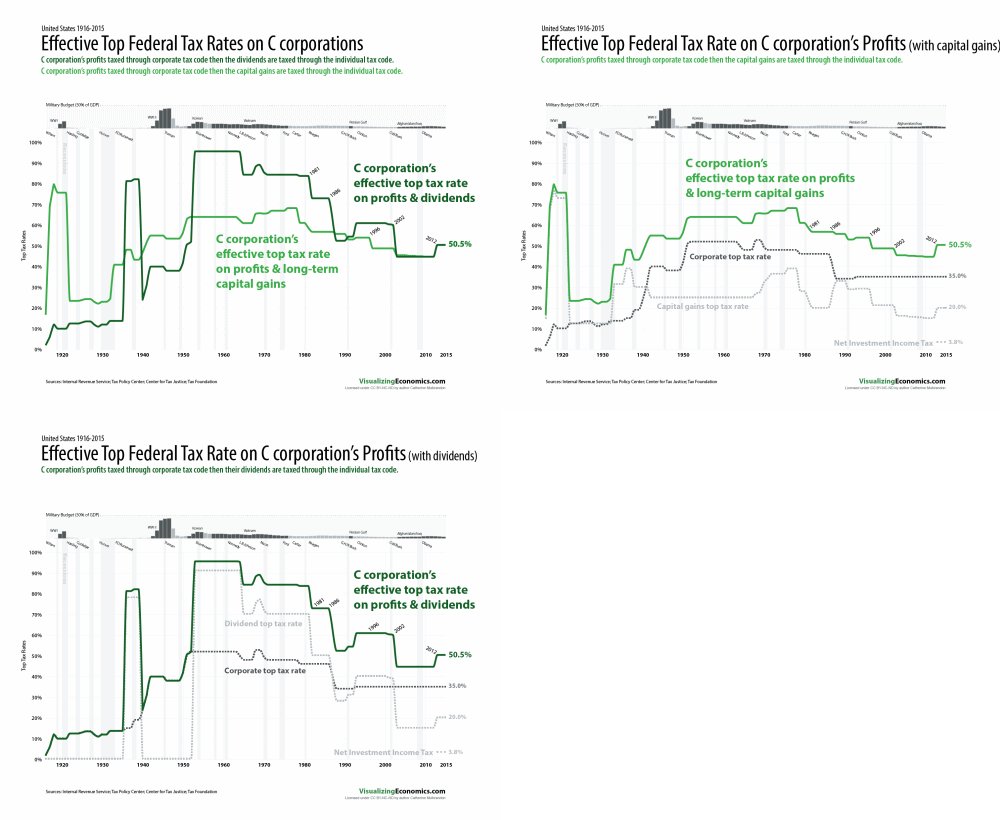
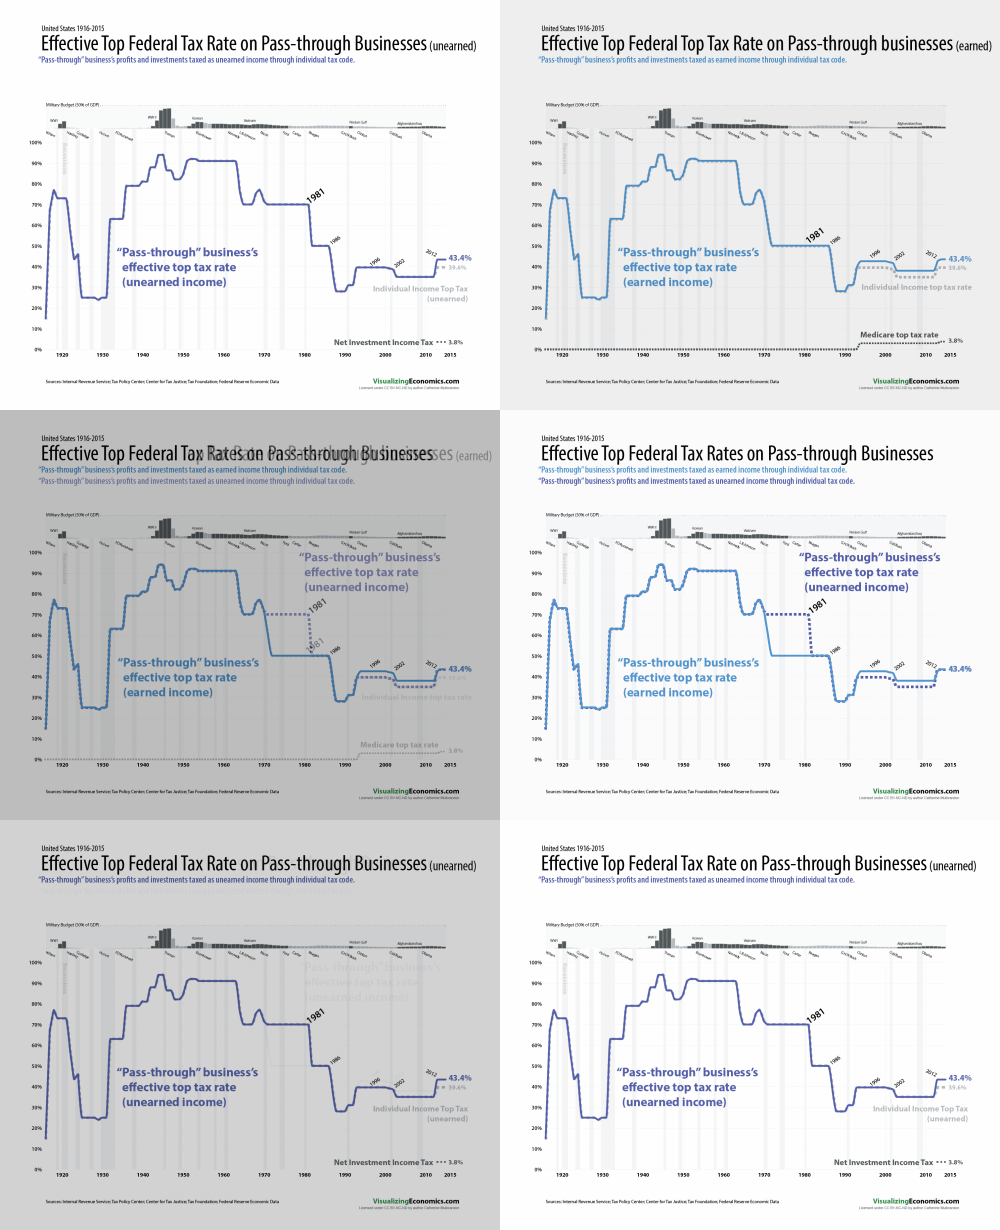
Data Notes: Tax rates are from Internal Revenue Service; Tax Policy Center; Center for Tax Justice; Tax Foundation and  more details on the tax rates available in Part 1 and Part 2 in the series.

Federal Reserve Economic Data is the source for net savings.

Related Posts Plugin for WordPress, Blogger...

Taxing Businesses: Tax Receipts

Part 5 of a series about Taxing Businesses

Although profits and therefore corporate tax receipts varied with the business cycle, the corporate tax receipts generally declined from the 1950s to late 1970s, falling to less than 3% of GDP in the bad economy due to inflation and oil shocks.  However Federal tax receipts collected from corporate tax code never returned to previous values when the economy recovered because the number of c corporations declined and the number of pass-throughs increased. With the increase in pass-throughs one would expect the receipts from individual income tax returns to increase but they didn't.

Related Posts Plugin for WordPress, Blogger...

Federal Tax Revenue as a percent of GDP

My last set of graphs shows the decline of C corporations since the 1980s while the share of pass-through businesses increased. Pass-through businesses do not pay taxes through the corporate tax code but through individual tax code. Here are the three main sources of federal revenue (% of GDP) and you can see how corporate income tax receipts were greater in the decades between 1940-1980 but with very little change in the individual income tax receipts.

Data is from the Office of Management and Budget, Historical Tables, Table 2.3

10/3/2017 Fixed y-axis label to read % of GDP

Related Posts Plugin for WordPress, Blogger...

Number of corporations has dropped since the 1980s

Share of business returns filed by C corporations has dropped 16.6% to 4.9% 1980-2012 with sole proprietorships filing the majority of business returns. At the same time, the net income reported by C corporations has dropped since 1980 from 68.0% to 37.1% in 2012.

A simple matrix of business structures and Pass-Through Businesses: Data and Policy provide more information but one thing you need to know is:

The majority of companies in the United States are pass-through businesses. These businesses are not subject to the corporate income tax; instead, their income is reported on their owners’ tax returns and subject to the individual income tax.

Data Source: IRS https://www.irs.gov/uac/soi-tax-stats-integrated-business-data Table 1: Selected financial data on businesses. 

Related Posts Plugin for WordPress, Blogger...