Mastodon

Aggregate

Change in incomes since 1967 (middle, upper-middle quintiles)

While seaching for more income research I stumble across a reference to Census and Fed reports about income and wealth at independentsources.com but they link to johnbatchelorshow.com which is copy of an op-ed piece from The Wall Street Journal. (Unfortunately neither site links to the actual reports.) But this quote from the op-ed caught my eye:

Back in 1967, the income range for the middle class (i.e., the middle-income quintile) was between $28,000 and $39,500 a year (in today's dollars). Now that income range is between $38,000 and $59,000 a year, which is to say that the middle class is now roughly $11,000 a year richer than 25 to 30 years ago. This helps explain why middle-income families can buy things like cable TV, air conditioning, DVD players, cell phones, second cars and so on, that were considered mostly luxury items for the rich in the 1950s and '60s.

The upper-middle class is also richer. Those falling within the 60th to 80th percentile in family income have an income range today of between $55,000 and $88,000 a year, which is about $24,000 a year higher than in 1967. This rapid upward income mobility indicates that the great American Dream, in which each generation achieves a higher living standard than their parents, is alive and well.

I looked at both the Census' Historical Income Tables for Households and for Families and it looks like the household data is a closer match to the data in the quote above but neither is an exact match. (Earlier I had graphed the share of family income going back to 1947 based on Census data, which is why I knew about the data tables. )

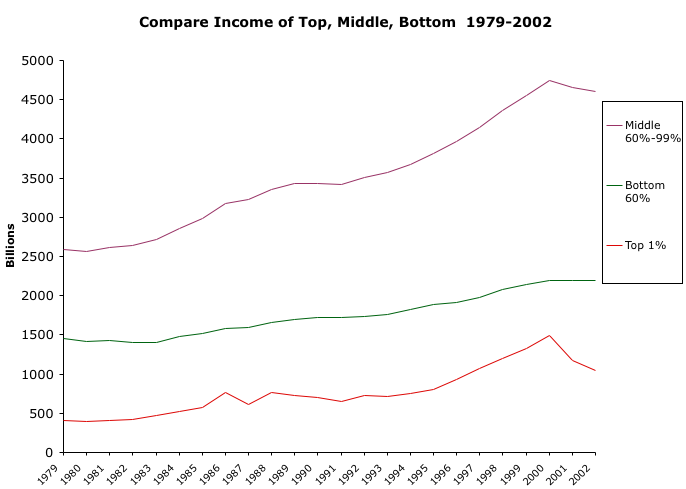
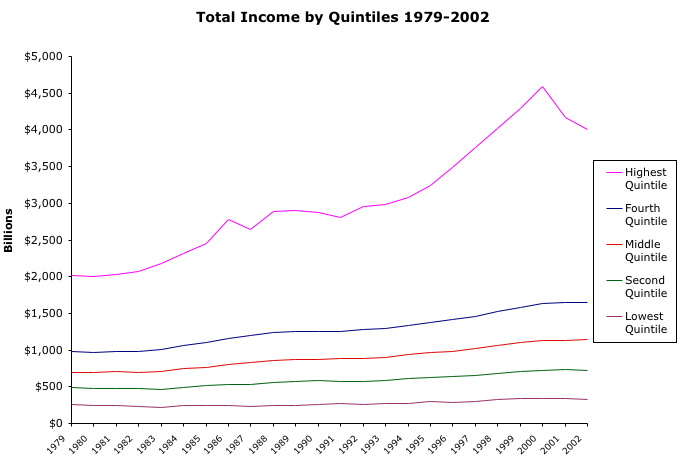
I went ahead and graphed the income ranges for the "middle class" 40-60 percentile and the "upper middle-class" 60-80 percentile mentioned in the op-ed (1967-2004), for both households and families. While the 40% and 60% lines are increasing over time it is the 80% line that is increasing the most. In other words, the higher your income the greater your increase in income.

householdncome_40_60_80
familyincome_40_60_80

Addendum: I am added the percentage increase for each chart Household - consists of all the people who occupy a house, an apartment or other group of rooms, or a single room occupied as separate living quarters. 40th percentile = 24% 60th percentile = 39% 80th percentile = 55%

Family - a group of two people or more related by birth, marriage, or adoption and residing together. 40th percentile = 34% 60th percentile = 52% 80th percentile = 68%

Looking at the definitions some of the differences between household data and family data could be due to an increase in two-income families.

Related Posts Plugin for WordPress, Blogger...

Total Income of Top, Middle, & Bottom

Income by Custom Percentiles

Another post on the CBO report. I combined the percentile income data for the past 20 years into three groups: bottom 60%, 60-95%, and top 5%.In 2002, if you lived in a household with a total income of:

    less than $39,800 per year then you were in the bottom 60%
    between $39,800 and $105,300 then you were in the 60-95% range
    greater than $105,300 then you were in the top 5%

The first thing I noticed was that in 1997, 1998, 1999, 2000 the total combined income of the top 5% was greater than the combined income of the bottom 60%.

The second thing I saw was the same income drop in 2000 from my earlier graphs (see: Changes in U.S. Total Income and Changes in Household Income by Quintiles). However, you can see that this dramatic decline is concentrated in the top 5%.

CBOIncomebyPercentile(top_one)

But looking at the graph below, it is in fact the top 1% that had the big decline, all of the previous graphs rolled up this change into the top 20% and top 5%. It even effected the total income. So in fact it wasn't the top 20% that was hit hard by the stock market crash but the top 1%.

Related Posts Plugin for WordPress, Blogger...

Changes in Household Income by Quintiles

Share of Income by Quintile Graph

Returning to the CBO report that looks at incomes across all households, I found a data table showing the change in the total income for each quintile (bottom 20%, 20-40%, 40-60%, 60-80% and the top 20%) over the past 20 years.In 2002, if you lived in a household with a total income of:

    less than $15,900 per year then you were in the bottom 20%
    between $15,900 and $27,300 then you were in the 20-40% group
    between $27,300 and $39,800 then you were in the 40-60% group
    between $39,800 and $59,400 then you were in the 60-80% group
    greater than $59,400 then you were in the top 20%

What caught my attention is the dramatic rise (and partial fall) of the income going to the top 20%. While the other quintiles do not display this pattern.

It looks like the drop in United States' total income (seen in the previous post) was due to the change in the top 20% alone.

As for the drop in income, what I think is going on is changes in the stock market effecting income. By looking at the S&P 500 index, we see the raise and fall in the stock market coincides with the changes in the top 20%'s income.

S&P500 1979-2002
Related Posts Plugin for WordPress, Blogger...