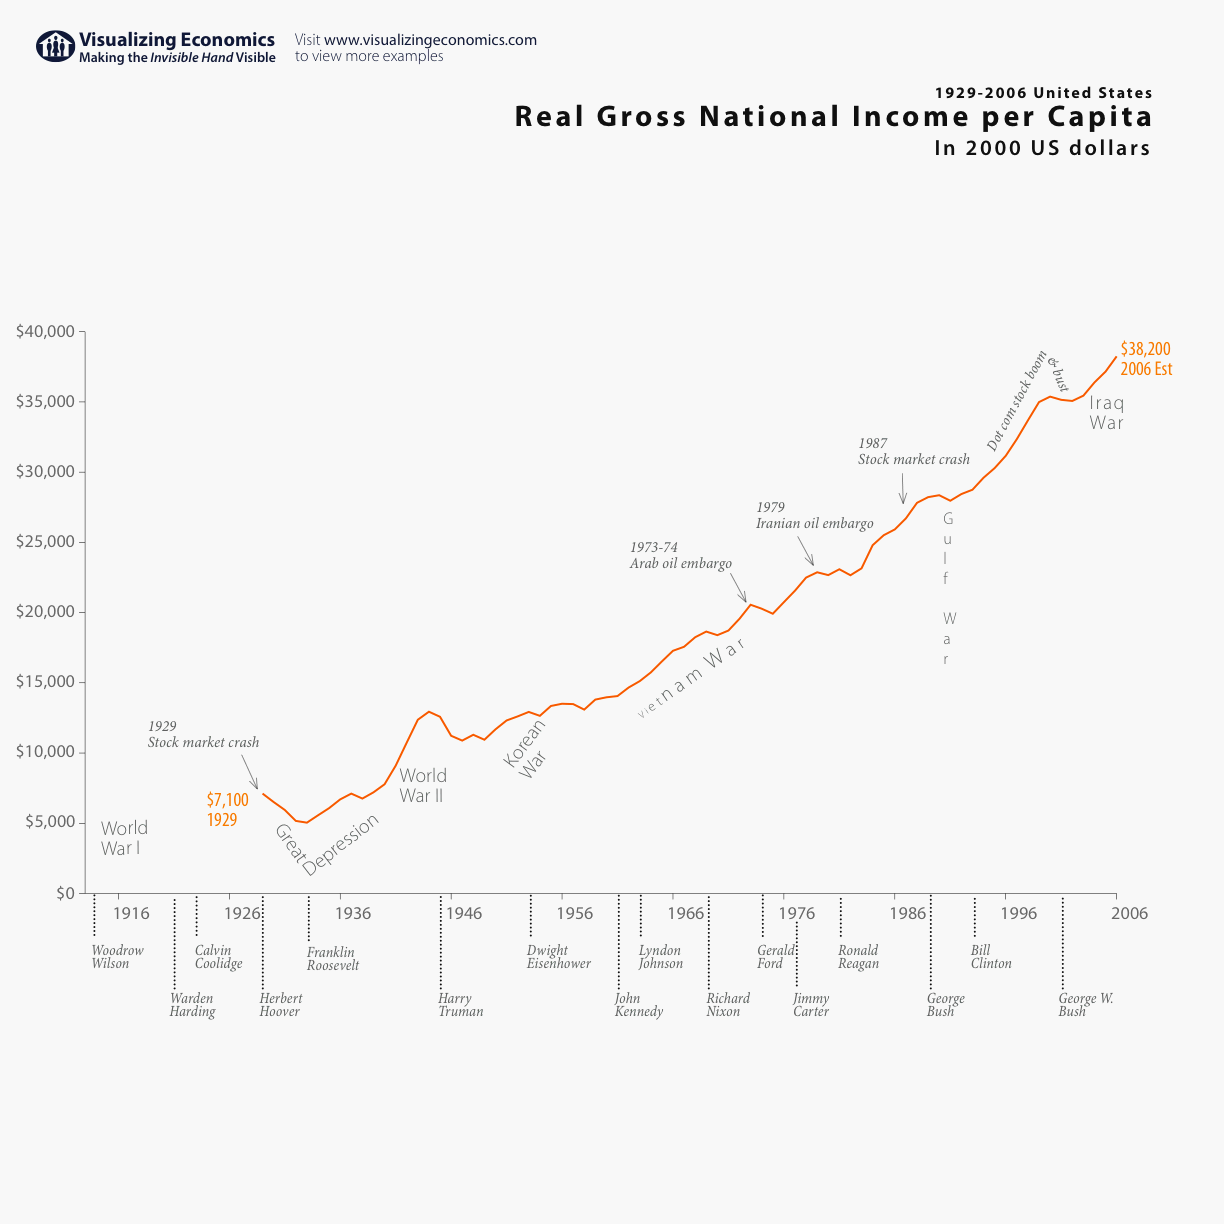
A NYT article about the .01 Percent had a quote from Warren Buffet that caught my attention: "'This is a significantly richer country than 10, 20, 30, 40, 50 years ago,' he declared, backing his assertion with a favorite statistic. The national income, divided by the population, is a very abundant $45,000 per capita, he said, a number that reflects an affluent nation but also obscures the lopsided income distribution intertwined with the prosperity." This graph was an attempt to visualize that statistic. (Keep in mind that the numbers are in 2000 US$) {Click on the graph to take a closer look}
The US Gross National Income (GNI) represents the total buying power of citizens of the United States. This buying power can be transferred around the economy by taxation and lending. GNI includes Wages and Salaries + Rents + Interest + Profits (also includes Depreciation of Capital + Sales taxes - Subsidies). Since it is "National" it measures income from resources owned by the citizens of the United States, regardless where the production occurs. Gross national income is identical to gross national product (GNP).
The Real GNI data can be found at Bureau of Economic Analysis National Economic Accounts Table 1.7.6. Population data can be found at Census Historical Series and Census Current Estimates .

