
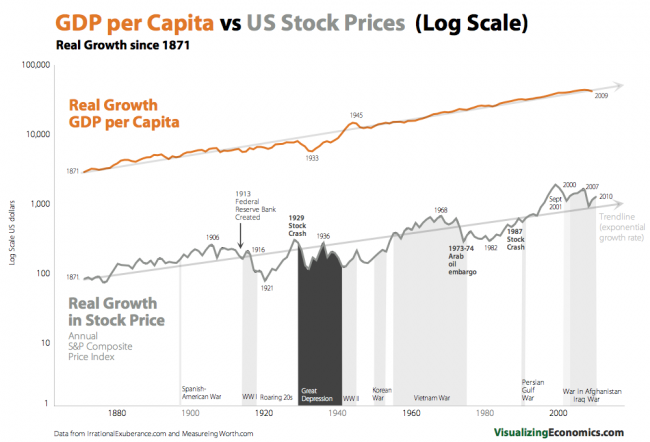
Comparing Real GDP per Capita growth to the real growth in S&P Composite (price only). However, the stock price series is adjusted for inflation using CPI-U while the GDP per Capita (from MesuringWorth.com) is adjusted with the GDP Deflator.
Annualized growth rate of since 1871:Real GDP per Capita = 2.0%Real stock price return = 1.9% compared to Real total return with dividends reinvested = 6.2%
Data from MeasuringWorth.com and IrrationalExuberance.com

Six real word examples of exponential growth in a Powerpoint slide show (3.7 MB) that includes 11 graphs of economic and financial data (linear and log scale). Data is from MeasuringWorth.org, Yahoo Finance, and Irrational Exuberance. Links to the data sets are included in the file. Images can be printed (B&W or color) for handouts.
- Real US GDP 1790-2012 (Linear & Log Graphs)
- Real US Stock Prices 1871-2012 (Linear & Log Graphs)
- General Electric Stock Price 1962-2013 (Linear & Log Graphs)
- US Population 1790-2012 (Linear & Log Graphs)
- Inflation Index 1774-2012 (Linear & Log Graphs)
- US GDP & Population 1790-2012 (Log Graph)
These graphs illustrate historical data series with constant growth rates and data series with changing growth rates over time. In addition, there is a example of adding/subtracting growth rates in log graph using US GDP, US Population & US GDP per person.
*** A few of people have had difficulty downloading in Firefox, if the download link does not work, try to copying the link into another browser. ***